Fix: Screenpipe High CPU Usage on Mac
Fan spinning, laptop hot, Activity Monitor shows screenpipe sitting well over 100% CPU — sometimes north of 10GB of RAM — and the app's own status still reports "healthy." That combination is exactly what got reported to the maintainers, not a one-off on your machine.
TL;DR
- This is a known, open issue with no single confirmed root cause — it is workload-dependent.
- FPS, OCR, multi-monitor setups, and debug builds all make it worse.
- There are real mitigations. There is no setting that makes 24/7 screen OCR free.
What people are saying
The clearest report is on the project's own tracker: a user measured Screenpipe using "over 100% CPU and more than 10 GB RAM" while the health check still reported everything fine — see screenpipe#183. No maintainer has posted a definitive root cause in that thread; it is explicitly workload-dependent (frame rate, OCR load, number of monitors, debug vs. release build). Separately, on Reddit, a commenter sizing up Rewind alternatives called Screenpipe's memory footprint "enormous" at 4GB just to run — r/macapps thread.
Why this keeps biting you
Screenpipe's pitch is also its cost center: it is a DIY, always-on capture pipeline running entirely on your own hardware. Every frame gets grabbed, OCR'd, and written to a local database, continuously, with no cloud to offload the work to. That is the whole point of an open-source local tool — but it means your laptop is doing the job a data-center GPU does for a cloud notetaker. Multiple monitors multiply the frame count. High FPS multiplies it again. A debug build (rather than a release binary) adds overhead on top of that. There is no cloud service quietly absorbing the load; your CPU is the cloud.
Fix it in Screenpipe first
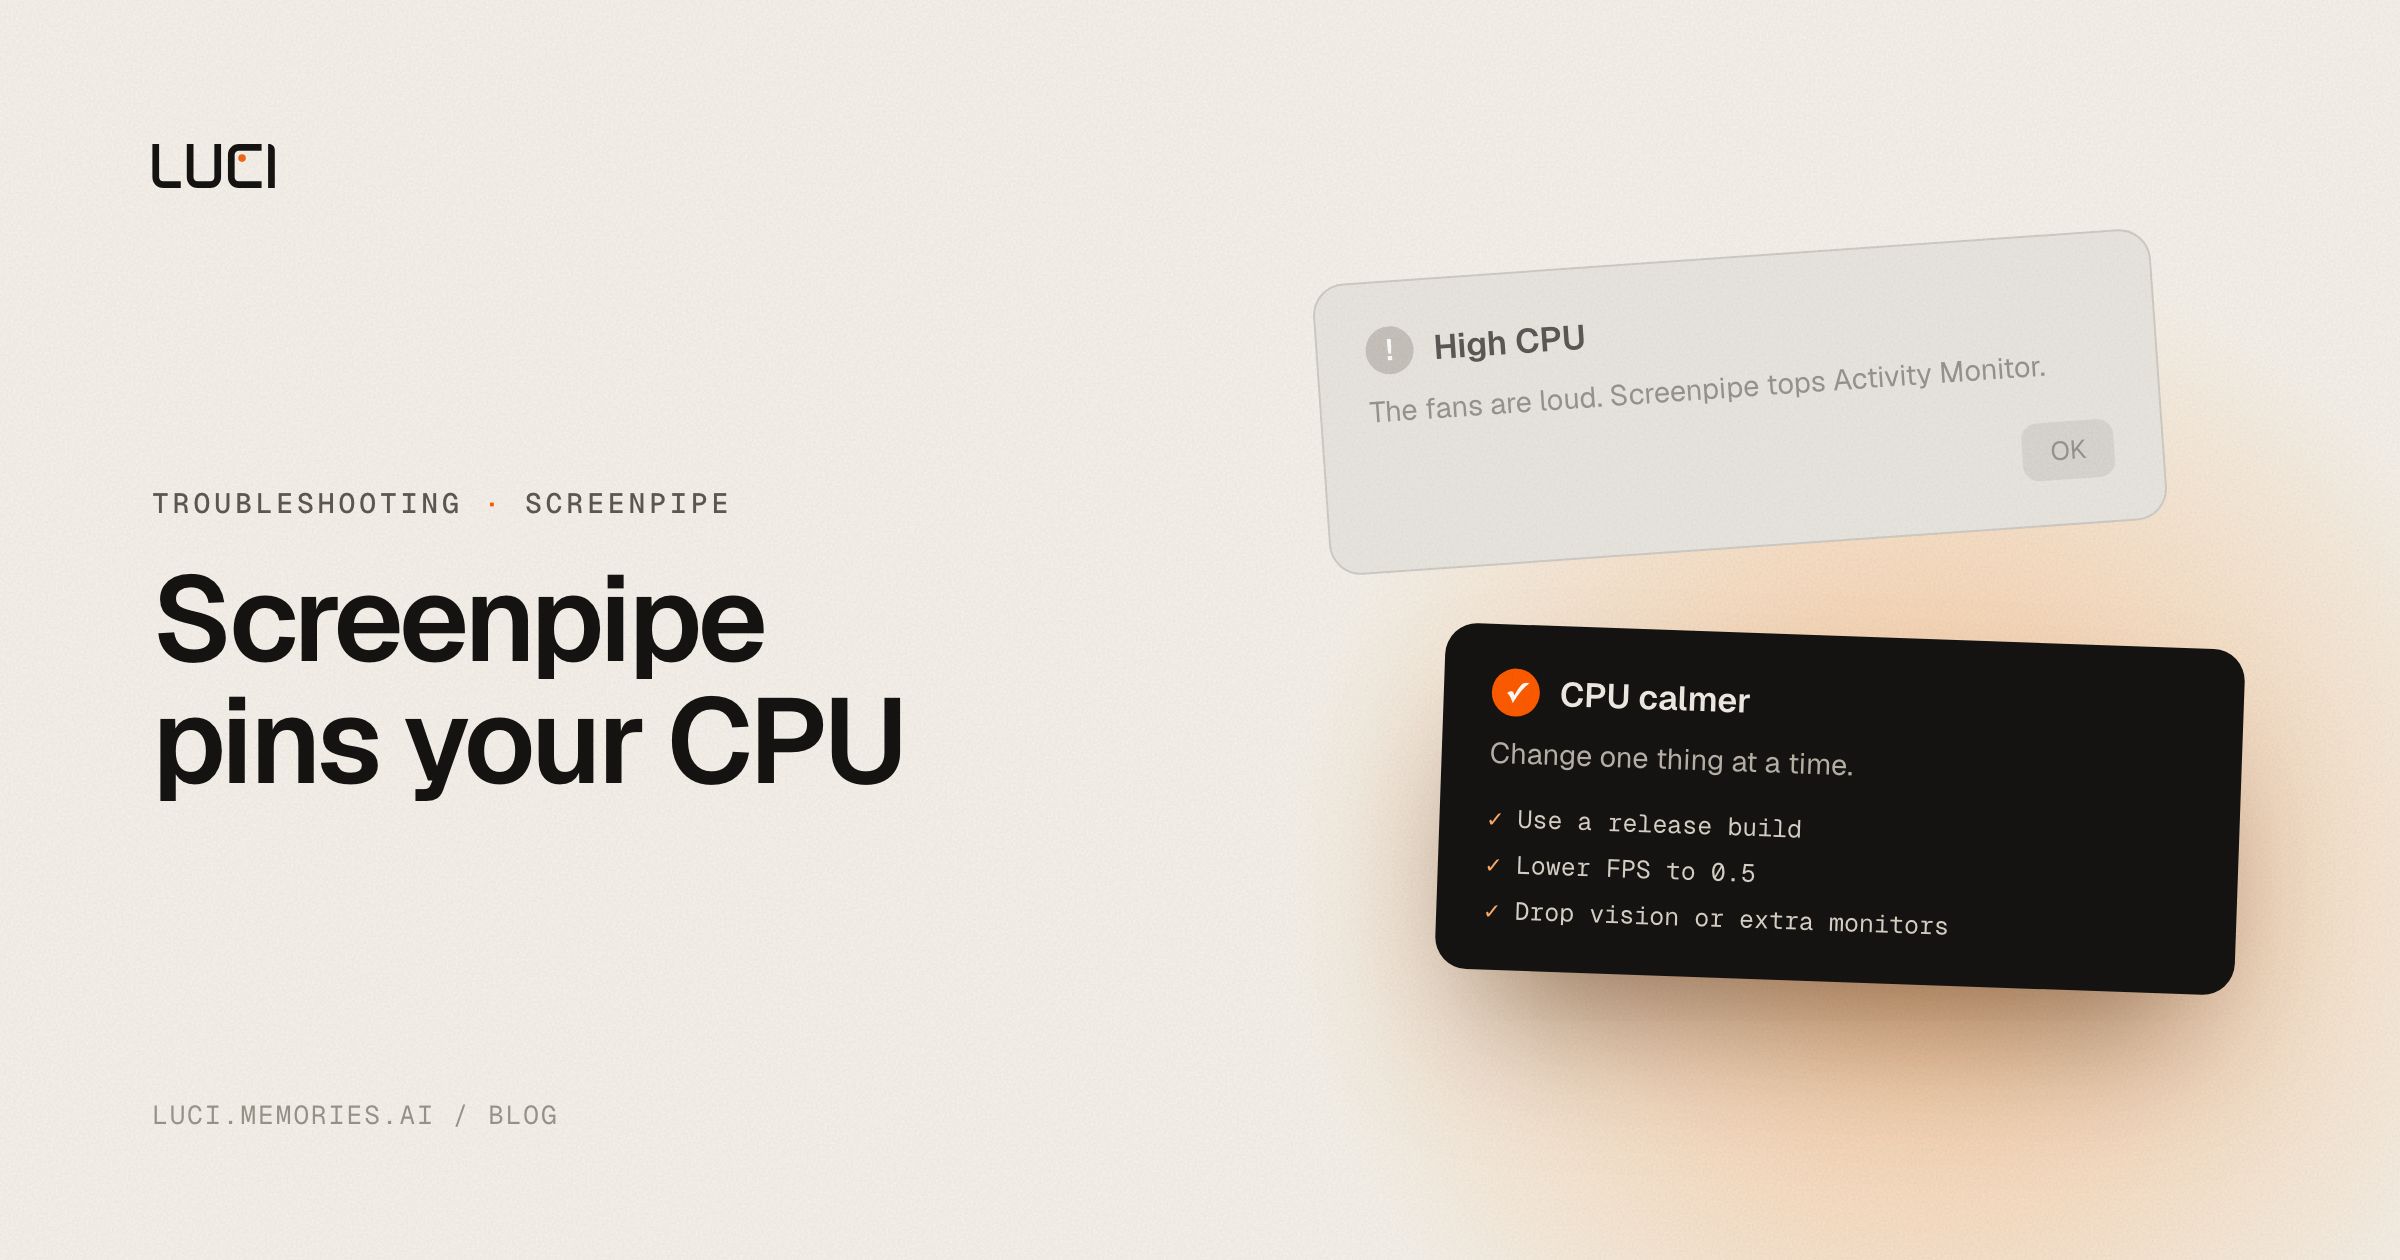
- Confirm you're on a release build, not a debug build. Debug builds carry real overhead — reinstall from the official release if you built from source.
- Lower capture FPS. Launch with a reduced frame rate flag, e.g.
--fps 0.5, instead of the default. - Disable vision if you only need audio.
--disable-visioncuts OCR entirely, which is usually the biggest single cost. - Cut monitor count. If you run two or three displays, restrict capture to the one that matters.
- Update to the current release. The maintainers have ongoing CPU/memory optimization work across releases — an old build is carrying bugs later versions fixed.
- Check Activity Monitor before and after each change, one at a time, so you know which flag actually helped.
If CPU is still pegged after all six steps, that is a real report worth filing on screenpipe#183 — not a sign you set it up wrong.
Stay or switch
| Job | Stay with Screenpipe | Switch to LUCI |
|---|---|---|
| You want to script your own OCR pipeline and don't mind tuning flags | Yes — that control is the product | No, LUCI doesn't expose that layer |
| You need 24/7 screen logging on a machine you don't mind running hot | Yes | LUCI is more selective by default |
| You want screen + meeting memory that doesn't need FPS tuning to stay usable | No | Yes |
| You want an agent that can act on what it remembers, not just a searchable log | No | Yes |
What to do next
Every hour Screenpipe spends pegging your CPU is an hour you're not searching your own screen history — you're waiting for a fan to spool down. If tuning flags and rebuilding from release isn't where you want to spend your afternoon, LUCI does on-device understanding without the manual FPS math. See the full LUCI vs Screenpipe comparison or the complete list of Screenpipe alternatives.